

How Low Will Bitcoin Go?
Our analytical approach to an impossible question
The Crypto Advisor is your trusted resource for navigating the world of cryptocurrency. Each week, we deliver a clear and concise update on the latest developments in crypto, straight to your inbox. This is more than just a newsletter; it’s an essential resource for forward-thinking advisors focused on maintaining a competitive edge. We’re excited to support your journey in adapting to and thriving in the new age of financial services.

How Low Will Bitcoin Go?
In every market cycle, no matter how complex the discussion becomes, conversations tend to converge on the same place. We tend to spend hours talking about macro liquidity conditions, positioning data, regulatory developments, institutional flows, or valuation frameworks. Those are the conversations we are supposed to be having - and they are important. But if you spend enough time speaking with clients, colleagues, or other market participants, most of those discussions eventually distill down to one simple question.
Sometimes it’s asked directly. Other times it shows up at the very end of a meeting, almost as an aside - half joke, half serious - usually on the way out the door.
“So… how low do you think Bitcoin could actually go?”
It’s a fair question, and it’s also an impossible one to answer with precision. Markets do not move in straight lines, bottoms are only obvious in hindsight, and no single model has ever consistently identified exact turning points across cycles. But that doesn’t mean the question itself is useless. In professional portfolio management, the goal is rarely to predict exact outcomes. The goal is to understand how risk is distributed, how expectations are evolving, and where markets begin to cluster around certain ranges of possibility.
Crypto is no exception to the fundamentals of finance.
In our approach, rather than trying to identify a single “bottom,” we focus on a more useful question: where do multiple independent frameworks begin to suggest downside risk is likely to concentrate?
That is the question this piece is designed to explore. Rather than relying on any single signal, we will look at two very different approaches - real-money probability markets that reflect live investor expectations, and long-term on-chain valuation models that function similarly to cost-basis frameworks by helping track how capital has historically moved through Bitcoin cycles. Neither method offers certainty. But when independent frameworks begin pointing toward similar downside zones, it can help frame the range of outcomes investors may want to be prepared for - regardless of where the exact bottom ultimately forms.
One way to understand how markets are currently distributing downside risk is to look at prediction markets. Because participants are committing capital to specific outcomes, they can serve as real-time maps of where investors are currently willing to place risk across potential price ranges.
Recent prediction market data suggests the highest concentration of downside probability currently sits in the broad sub-$50,000 range, with probabilities declining gradually as you move deeper into the $40,000s and then transitioning into lower-probability tail outcomes below that zone. In practical terms, markets are currently treating a move below $50,000 as a meaningful but not extreme scenario, while deeper downside into the low-$40,000s or below is still viewed as possible, but increasingly conditional on additional macro or liquidity stress.
Kalshi data currently shows roughly 79% probability of Bitcoin trading below $60,000, approximately 68% below $55,000, and about 59% below $50,000. From there, probabilities begin to fall more quickly, with roughly 47% assigned to moves below $45,000 and approximately 37% below $40,000. This distribution suggests markets are pricing continued downside risk as a realistic base-case scenario, while still treating deeper drawdowns as increasingly dependent on external catalysts rather than structural inevitability.
Polymarket data broadly reinforces this distribution, with roughly 78% probability assigned to moves below $55,000, approximately 63% below $50,000, around 43% below $45,000, roughly 36% below $40,000, and near 22% probability of moves below $35,000. The most notable transition appears to occur between roughly $45,000 and $50,000, where downside probabilities shift from high-conviction expectations into more balanced outcomes. In practical terms, this suggests markets are currently pricing meaningful downside volatility, while still treating deep bear-case scenarios as possible but not dominant expectations.
Another useful way to frame potential downside risk - and ultimately help inform the question we are trying to answer, how low will Bitcoin go - comes from on-chain valuation work popularized by market analyst Ben Cowen, who has spent years studying long-term cycle behavior through blockchain-derived price models. While this framework approaches the question from a completely different angle than prediction markets, it instead attempts to answer where durable cycle bottoms have historically tended to form relative to the broader cost structure of the market.
These models are typically referred to as on-chain valuation models, but in practice, they function similarly to cost-basis frameworks by helping illustrate where capital has historically accumulated, been distributed, and ultimately reset during prior Bitcoin cycles. Rather than reflecting forward-looking investor belief like prediction markets, these models instead focus on historical capital behavior and long-term structural positioning across market participants.
Cowen’s framework largely centers around three primary on-chain price models - transferred price, realized price, and balanced price - often referred to simply as “the three lines.” Historically, these levels have provided useful context for understanding where markets tend to transition from late-cycle drawdown into longer-term accumulation phases.
Here are the three key definitions:
Transferred Price - A long-term on-chain metric that reflects the average price level at which Bitcoin has historically been spent across the network’s lifetime, acting as a behavioral average of economic activity.
Realized Price - The average price at which all Bitcoin last moved on-chain, commonly viewed as a market-wide cost basis proxy for current holders.
Balanced Price - A derived metric based on transferred price and realized price that has historically helped identify levels where excess speculation has been flushed from the system, with durable cycle bottoms often forming near or slightly below this level.
Cowen’s core argument is that because Bitcoin has historically fallen below the realized price during major drawdowns - and, in most cycles, has also gone on to fall below the balanced price before forming a durable bottom - there are reasonably good historical odds that both levels at least get tested during a full cycle reset. In other words, while these levels are not precise price targets, they have historically acted as structural checkpoints where late-cycle excess is fully cleared from the market.
As of right now, these moving targets sit at roughly $55,000 for realized price and around $40,000 for balanced price. If historical cycle behavior were to broadly repeat, this would suggest Bitcoin would at least be expected to test levels near realized price during deeper drawdowns, with durable long-term bottoms historically forming closer to, or slightly below, balanced price levels. That does not guarantee the same outcome this cycle, but it does provide historical context for where full market reset behavior has tended to occur.
Taken together, what makes this analysis compelling is not that either framework produces a precise price target, but that two completely different approaches - one forward-looking and belief-driven, the other historically grounded and behavior-driven - are currently pointing toward broadly similar downside zones. Prediction markets are currently pricing the highest concentration of downside probability in the broad sub-$50,000 range, with the most important transition zone appearing to sit in the mid-to-high $40,000s. Meanwhile, long-term on-chain valuation models suggest that major cycle drawdowns have historically included tests of realized price, currently around $55,000, with durable long-term bottoms often forming closer to, or slightly below, balanced price levels, currently near $40,000.
Each framework, however, comes with limitations. Prediction markets are highly reflexive and can shift quickly as price moves, meaning they are better viewed as real-time maps of current belief rather than forward-looking forecasts. On-chain valuation models, while grounded in historical behavior, are backward-looking by nature and cannot account for structural changes in market participants, institutional adoption, or macro regime shifts that may alter how future cycles behave. In other words, neither framework should be viewed as deterministic.
The most practical takeaway is not that Bitcoin must trade to any specific level, but that multiple independent methods are currently identifying a similar downside risk corridor. That type of convergence does not guarantee outcomes, but it can help frame the range of scenarios investors may want to be prepared for. Ultimately, bottoms are only obvious in hindsight, but understanding where risk may begin to concentrate can help inform positioning decisions long before that hindsight becomes available.
Of course, none of this fully answers the original question. If anything, it just gives a more honest version of the answer most of us end up giving anyway: it depends, but here’s where risk appears to start concentrating.

Goldman Sachs Reveals $2.3B Crypto Exposure, Signaling Continued Institutional Adoption Through ETFs

Goldman Sachs disclosed more than $2.3 billion in total digital asset exposure in its Q4 2025 13F filing, offering another data point on how large financial institutions are approaching crypto allocation. The exposure includes roughly $1.1 billion tied to Bitcoin, approximately $1.0 billion to Ethereum, about $153 million to XRP, and roughly $108 million to Solana. In aggregate, the allocation represents about 0.33% of Goldman’s reported investment portfolio and is primarily expressed through ETFs and similar regulated vehicles rather than direct token custody.
Goldman’s positioning reinforces a broader institutional trend toward accessing digital assets through regulated wrappers that help address custody, compliance, and operational risk. The disclosure is particularly notable given the firm’s historically cautious stance on crypto and suggests that while digital assets remain a small allocation within diversified portfolios, participation through ETFs, structured products, and tokenization initiatives continues to gain acceptance across traditional financial markets.
BlackRock Is Stepping Foot Into Decentralized Finance

BlackRock is taking its first meaningful step into decentralized finance by making its tokenized U.S. Treasury fund, BUIDL, tradable on the decentralized exchange Uniswap. The move allows pre-approved investors to trade the fund 24/7 using stablecoins through UniswapX, with Securitize managing compliance, investor qualification, and transaction facilitation. BlackRock also disclosed a strategic investment in Uniswap and the purchase of UNI tokens, which helped drive a roughly 25% increase in UNI’s price following the announcement.
Robert Mitchnick, BlackRock’s global head of digital assets, described the initiative as part of a broader infrastructure shift: “This collaboration with Uniswap Labs alongside Securitize is a notable step in the convergence of tokenized assets with decentralized finance. The integration of BUIDL into UniswapX marks a major leap forward in the interoperability of tokenized USD yield funds with stablecoins.” As of the current time, access remains restricted to qualified and whitelisted participants. The integration demonstrates how tokenized real-world assets are beginning to utilize DeFi rails for trading, settlement, and liquidity - potentially expanding distribution channels while maintaining compliance guardrails.

Google Search Trends Indicate Crypto Interest Is Low
Google Trends is a public data tool that measures relative search interest for specific terms over time, providing insight into public attention and retail engagement rather than capital flows or institutional positioning. For advisors, it can be a useful behavioral signal - helping gauge when retail curiosity is rising or fading - but it should be viewed as a sentiment indicator, not an investment signal or valuation tool.
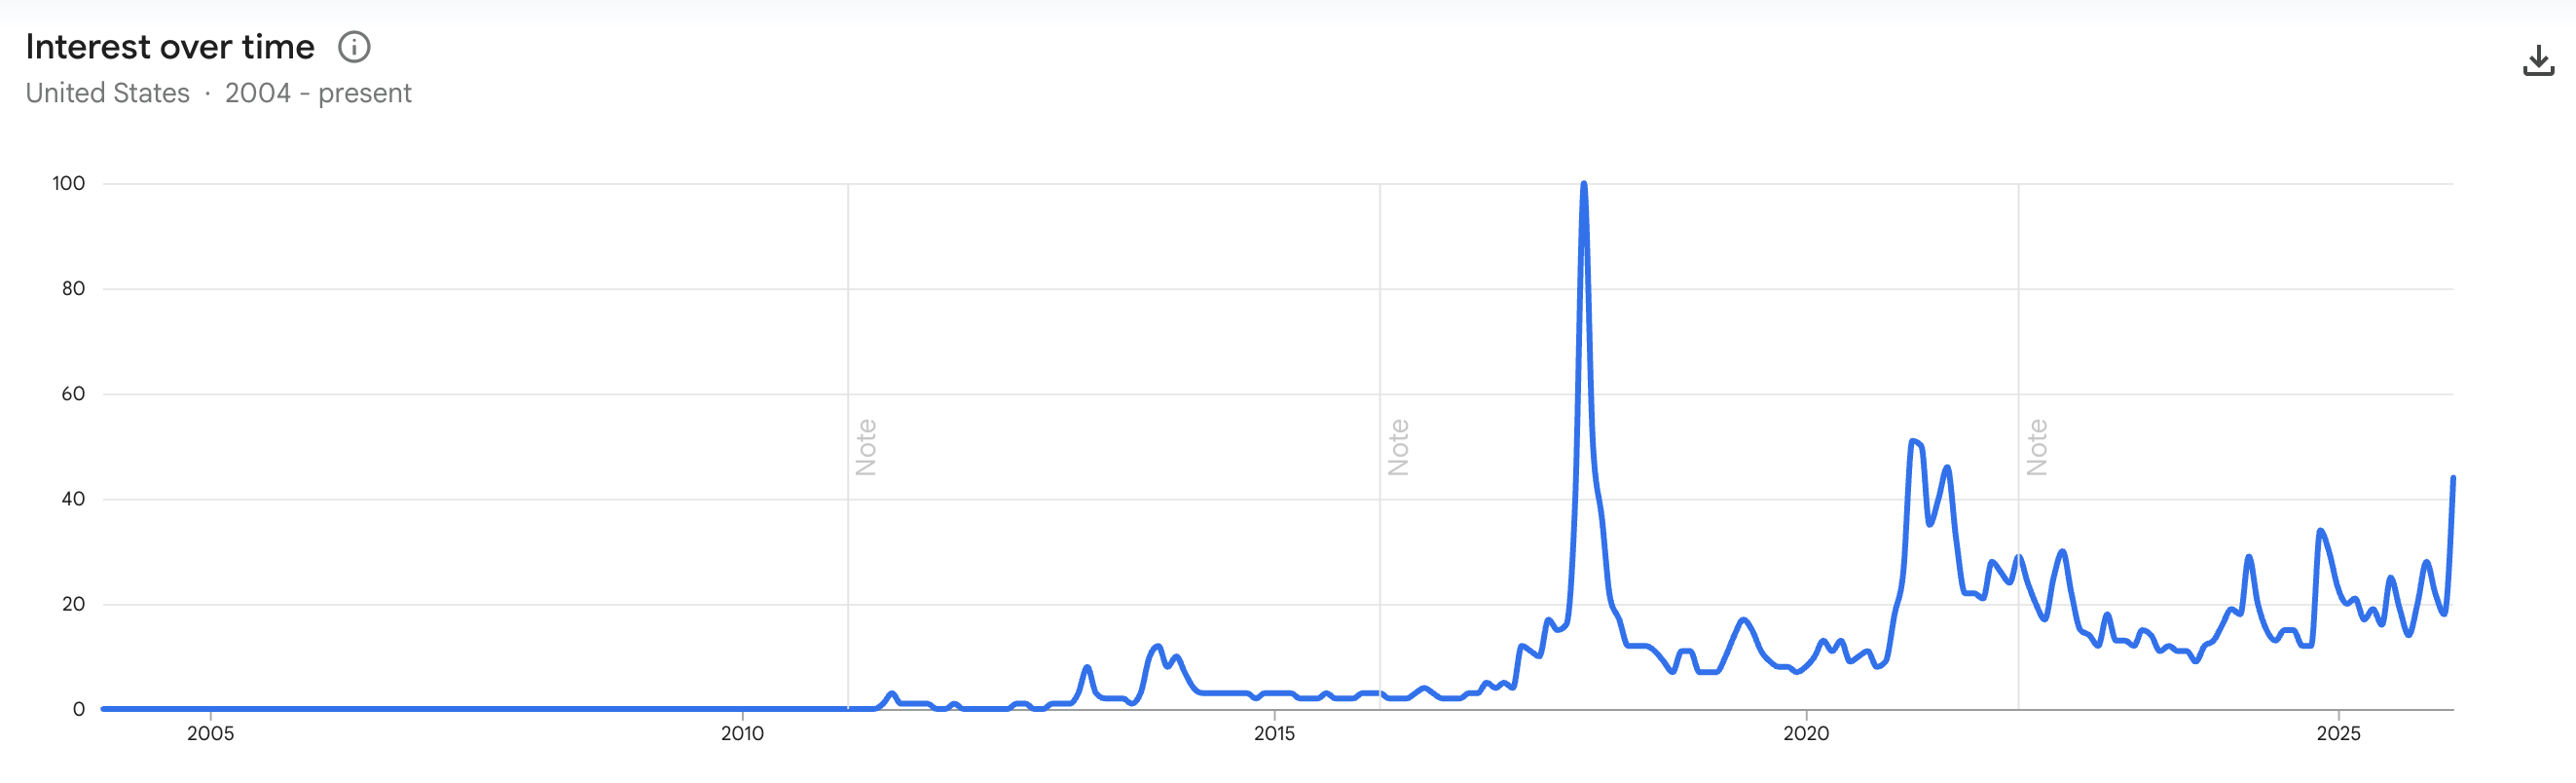
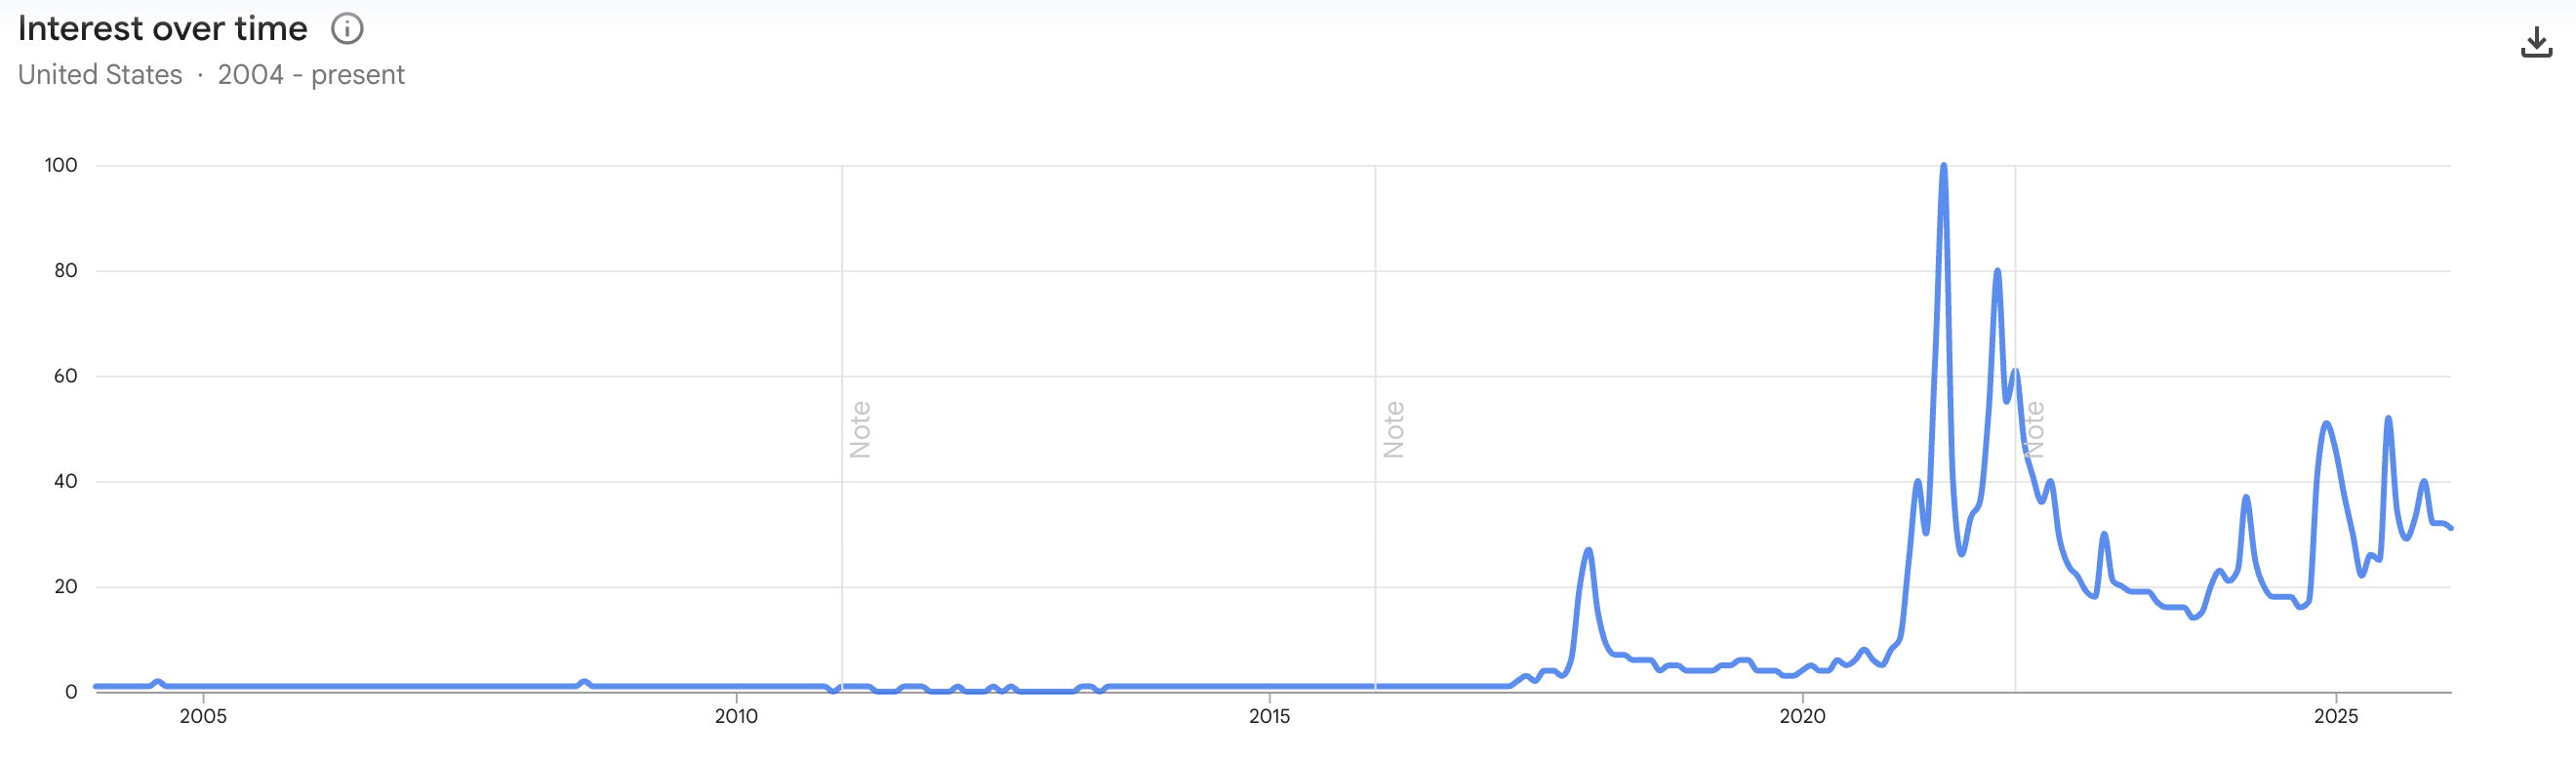
Right now, search interest for crypto has dropped close to one-year lows, reflecting how weak investor sentiment has become during the recent market downturn. Global Google search volume for “crypto” is currently around 30 out of 100, far below the peak reading of 100 in August 2025 when total crypto market cap was above $4.2 trillion, and closer to the yearly low of 24. Trading activity tells a similar story, with total market volume falling from roughly $153 billion in mid-January to about $87.5 billion recently, reinforcing the idea that retail engagement and speculative activity have faded alongside prices.
Other sentiment indicators are showing similar stress. The Crypto Fear & Greed Index recently fell to a record low of 5, signaling “extreme fear,” with current sentiment often compared to post-2022 Terra collapse conditions. In practical terms, fewer people are searching for crypto, fewer people are actively trading, and overall market psychology is approaching levels historically associated with late-stage bear market stress periods.
Bitcoin:
Crypto:
Disclaimer: The information provided by The Crypto Advisor is for educational and informational purposes only and does not constitute financial, investment, or legal advice. The Crypto Advisor is not a registered investment advisor, broker-dealer, or financial planner. Nothing in this email should be interpreted as a recommendation to buy, sell, or hold any financial instrument or investment. Always consult with a licensed financial professional before making any investment decisions.